QuantumStocks

The power of A.I. and Predictive Analytics in stock picking

Machine Intelligence on Quantitative Models. Your statistical edge in stock trading.

Daily signals from self-learning system with 3M+ Quant Model backtests on 3,500 U.S. stocks


Trade with Confidence like Never Before

Stock trading shouldn't be a guessing game anymore.

The underlying technology is constantly analyzing information for approximately 3,500 U.S.-listed equities.

Every day, it processes more than 3 million action signals and trend-cycle indicators from industry-standard and proprietary trend analyzers, oscillators, candlestick patterns, as well as quant models based on financials and social media posts.

Amplify Your Intelligence

Individual Investors

  • Get daily best stock opportunities filtered from most successful trading strategies by Artificial Intelligence.
  • Know your expected risk/reward profile with every possible trade, Take Profit & Stop Loss points.
  • Interested in a stock? Add it to your watchlist and get e-mail alerts when the time is best to buy or sell it.

Professional Traders

  • Find out which strategies are best to apply on which securities.
  • Discover similar historical patterns to gain actionable insight into upside/downside probabilities.
  • Create and apply sophisticated Quant Models by custom screeners, signal API and automated back-tests.

Lookup a stock

How it works

Trade with Confidence

  • Arizet's self-learning system continuously evaluates models based on their probability of success.
  • Each model is analyzed separately on every stock in the 3,500 U.S. stock universe, as well as on sectors and market cap groups.
  • Combined Quant Scores and BUY/SELL signals reflect the combination of ALL model-generated signals weighted by their models' rankings.

Know your Risks & Rewards

  • Arizet's QuantumStocks system provides potential Gain vs. Loss analytics with every trade recommendation.
  • It also provides Take Profit & Stop Loss recommended points from statistical analysis based on historical probabilities.
  • You can choose trading opportunities based on your risk appetite.

Get Daily Trading Alerts

  • You can "Follow" stocks by adding them to your Watchlist.
  • Arizet will send you daily e-mail notifications with the updated BUY/SELL signals on the stocks in your Watchlist.
  • You will also get automatic daily alerts on best BUY and SELL opportunities based on stocks' Overall Quant Scores and model-generated signals.

Stock Analytics

Quant Sentiment Score

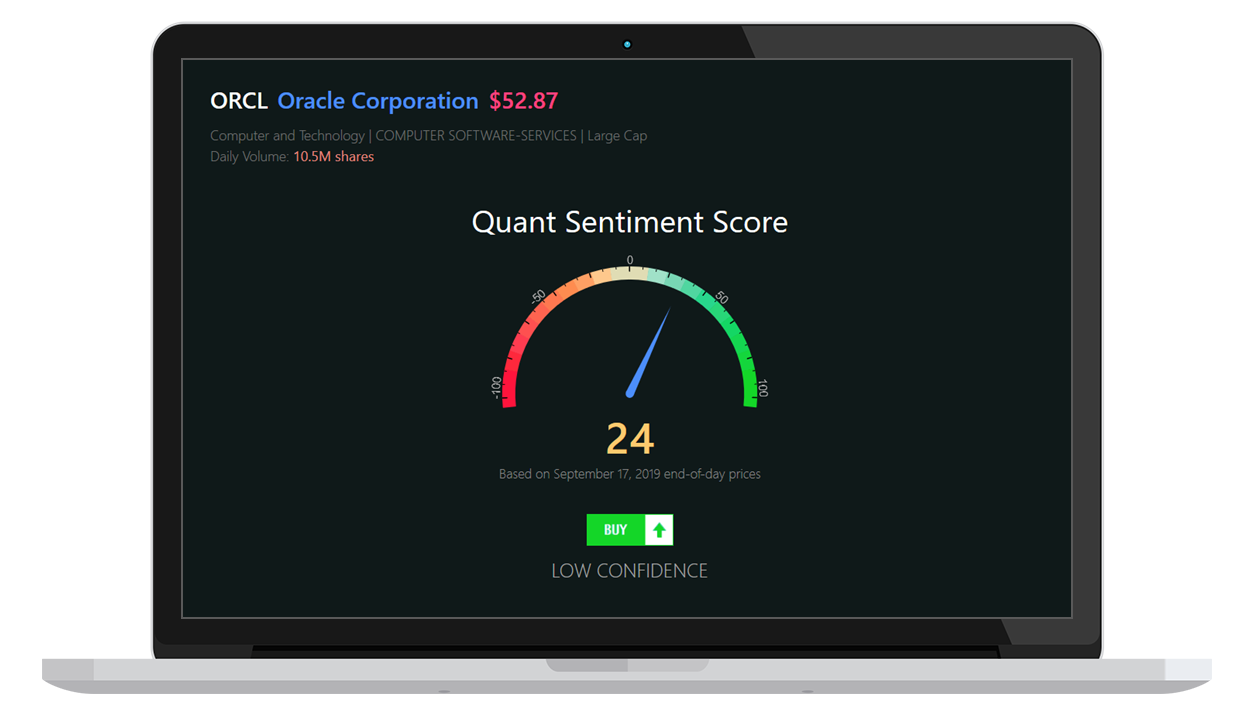
The Quant Sentiment Score is calculated from the combination of all action signals and cycle indicators for the specific stock on the specific day.

Ranging from -100 to +100, the Score takes into account all BUY and SELL action signals and BULLISH/BEARISH cycle indicators, weighted by the ratings of the Models.

Based on the Combined Score, the system ranks stocks to BUYs, SELLs, or HOLDs, with confidence ranging from VERY HIGH to VERY LOW.

Quant Scores are re-calculated on a daily basis, after U.S. stock market closes.

Signals Heatmap

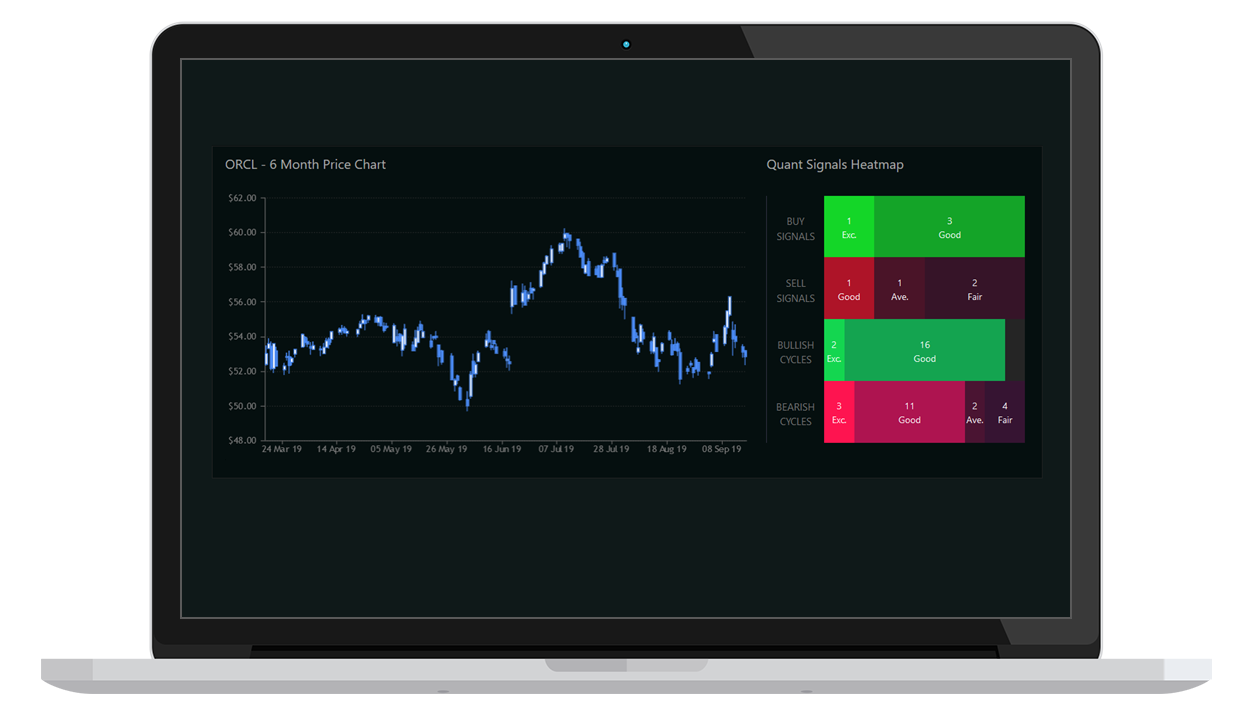
Signals Heatmap visualizes BUY/SELL signals, BULLISH/BEARISH cycle indicators, and their ratings on the stock for a given date. Ratings include:

  • EXCELLENT - The model has greater than 87% success rate.
  • GOOD - The model's success rate is between 67% and 87%.
  • AVERAGE - Models with 57% to 67% success rates are rates as average.
  • FAIR - More that 50% but less than 67% success rates.
  • POOR - The model doesn't have any predictive power for the stock.

Expected Gain/Loss Analytics

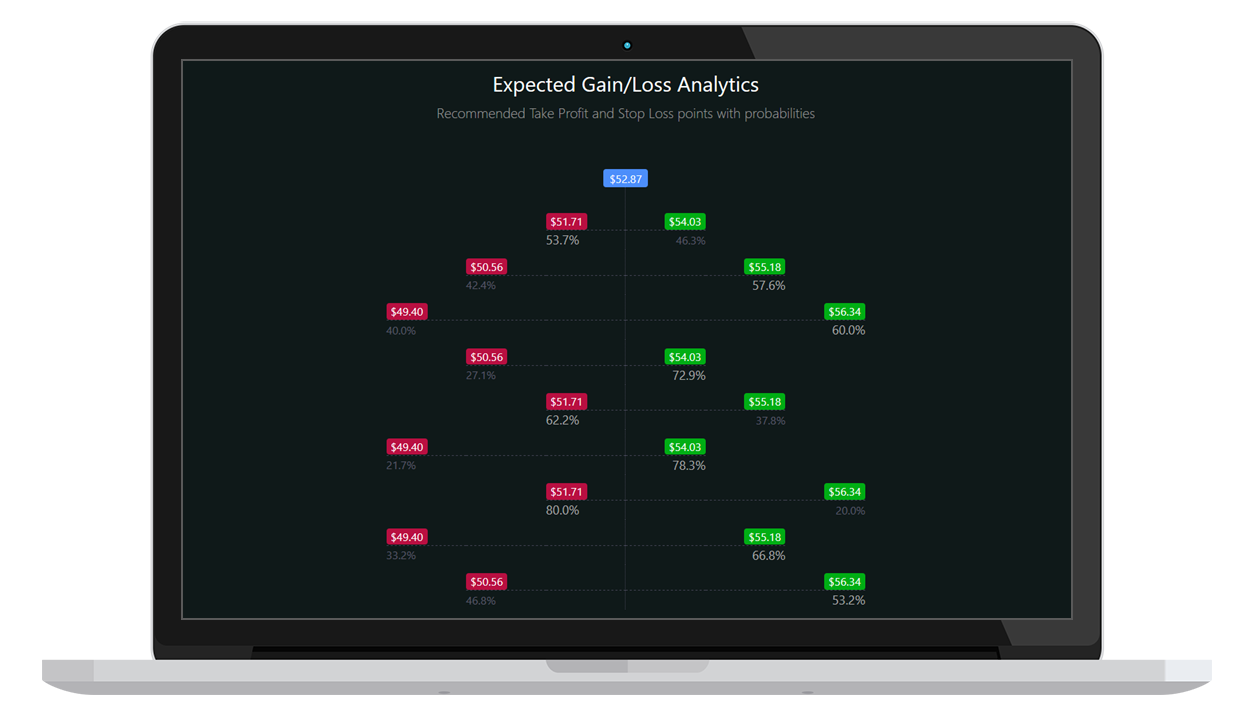
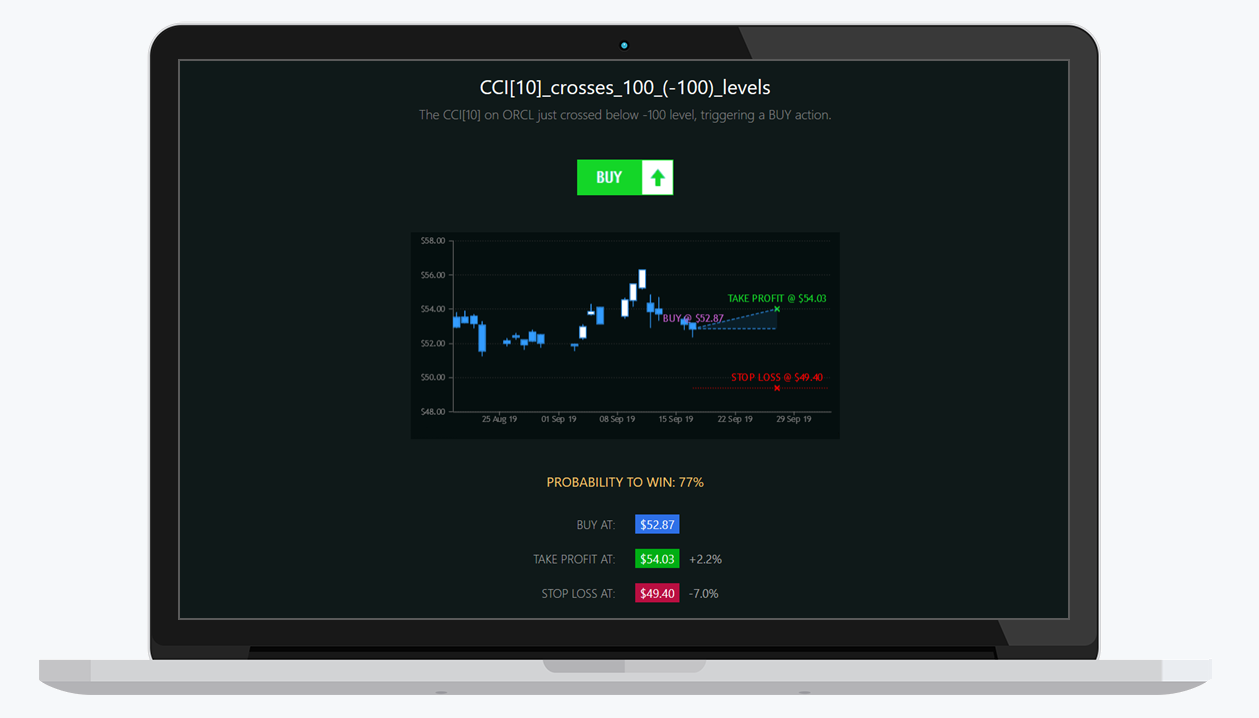
With every BUY or SELL signal, QuantumStocks provides probabilistic analysis on potential gain and loss for different exit points.

Probabilities are calculated from thousands of backtest results where machine intelligence tests and learns patterns based on dozens of simulated exit strategies.

Different levels of potential exits are calculated based on stock price volatility and last 20 day ATR value (Average True Range)

Each row in the tree represents a pair of upside/downside points. For example, the first line tells that there is 62.2% chance that the stock price will reach $126.99 BEFORE reaching $116.41.

Quant Model List

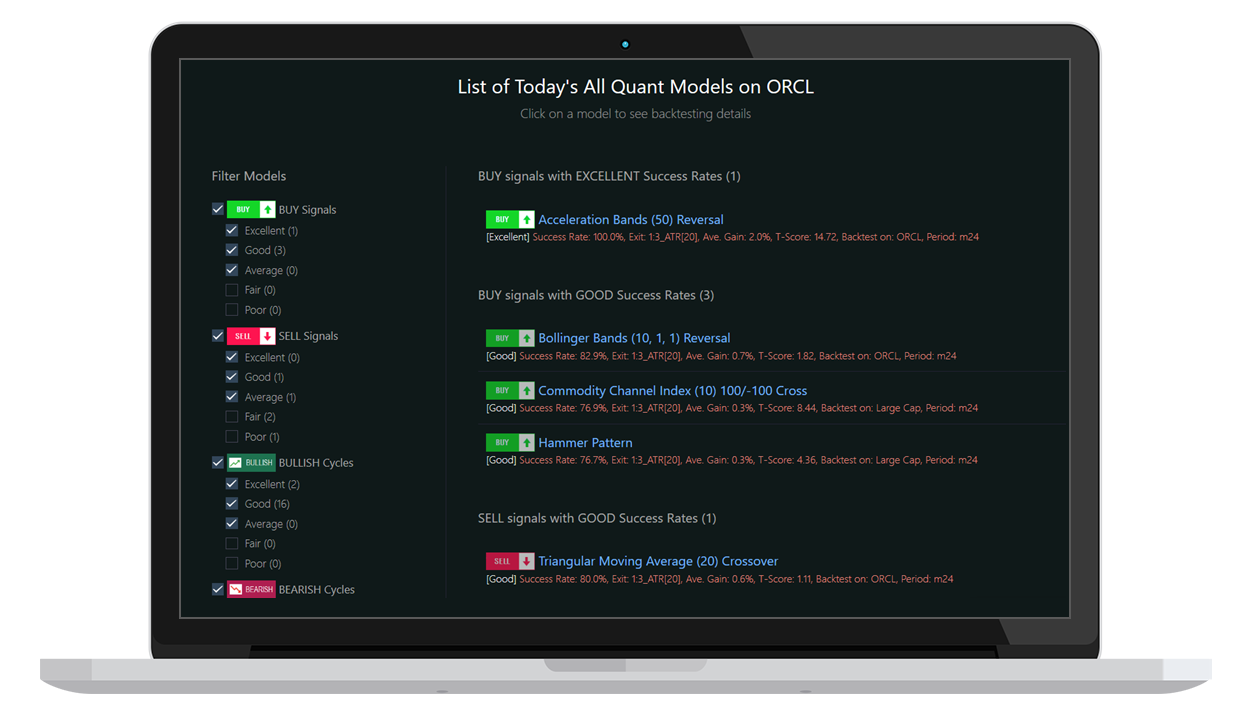
The list shows all Quant Models that have an action signal or trend-cycle indicator on the stock for today.

Models are grouped first by their signals/cycles, then by their ratings.

Along with the name and rating, the list shows results of the best back-test for Model/Stock pair, including backtest period, Exit Strategy, Success Rate, Average Gain and T-Score.

By clicking on the list item, you can delve deeper into Model details by opening Model Analytics view.

Similar Pattern Discovery

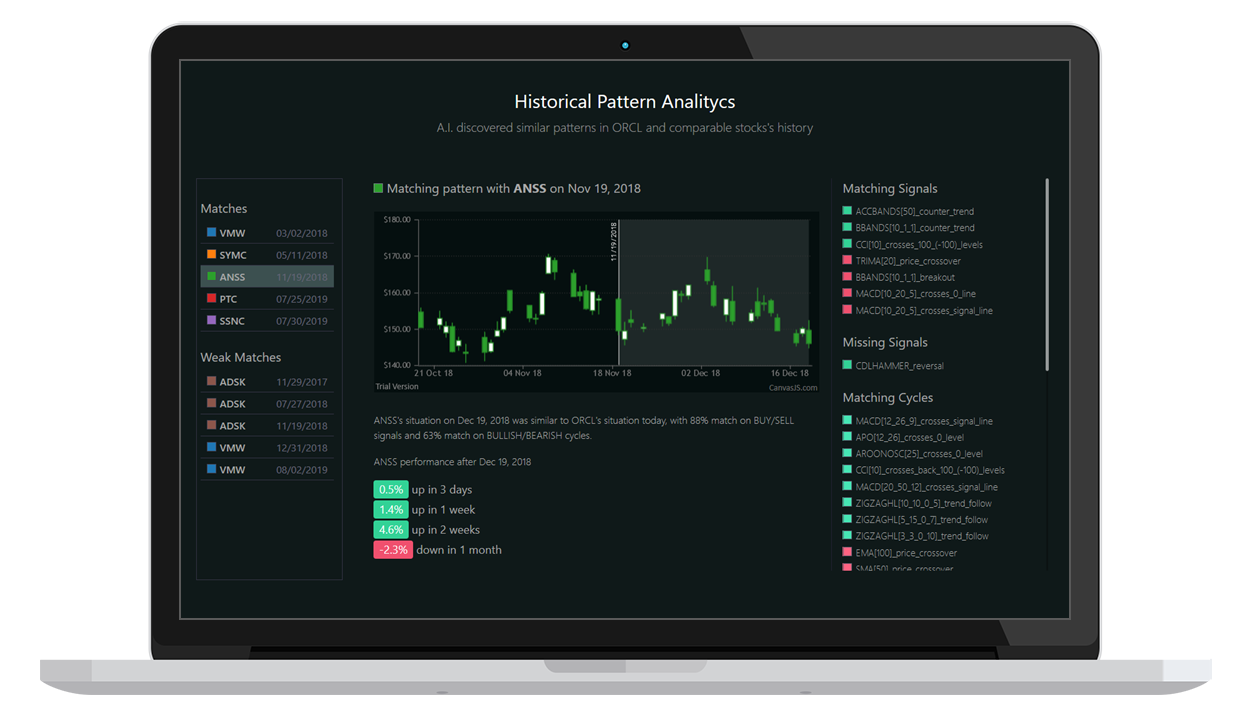
Another unique feature from Arizet's A.I. engine available to "Plus" and "Pro" users is discovering similar patterns in history to better understand underlying risks and opportunities.

Similar pattern and subsequent 3 day, 1 week, 2 week and 1 month period stock price analytics allows you to further minimize risks and focus only on best opportunities.

By analyzing matching and missing signals and cycles, you can better understand how the patterns evolved over time and how different combinations of signals/cycles drive the stock prices.

Model & Backtest Analytics

Action Signal from the Model

There are four possible outputs from each Model for each stock: BUY signal, SELL signal, BULLISH cycle, BEARISH cycle.

BUY and SELL signals are calls for action based on today's closing price. BULLISH and BEARISH indicate that the stock is in a bullish or bearish cycle, though no action is recommended for today. Bullish cycle is either Up-Trend or Oversold situation, while Bearish cycle means Down-Trend or Overbought state.

Along with BUY and SELL action signals, Arizet provides TAKE PROFIT and STOP LOSS recommended exit points based on historical trading data and probabilities.

Model Rating Details

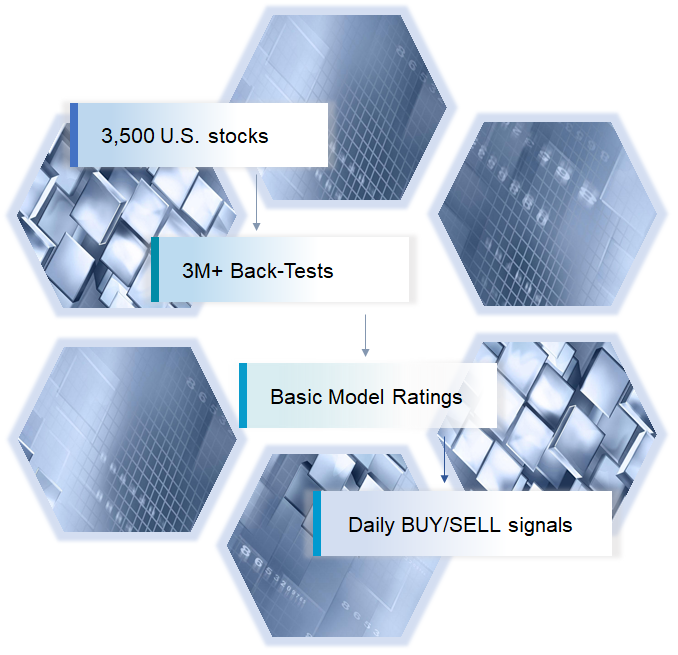
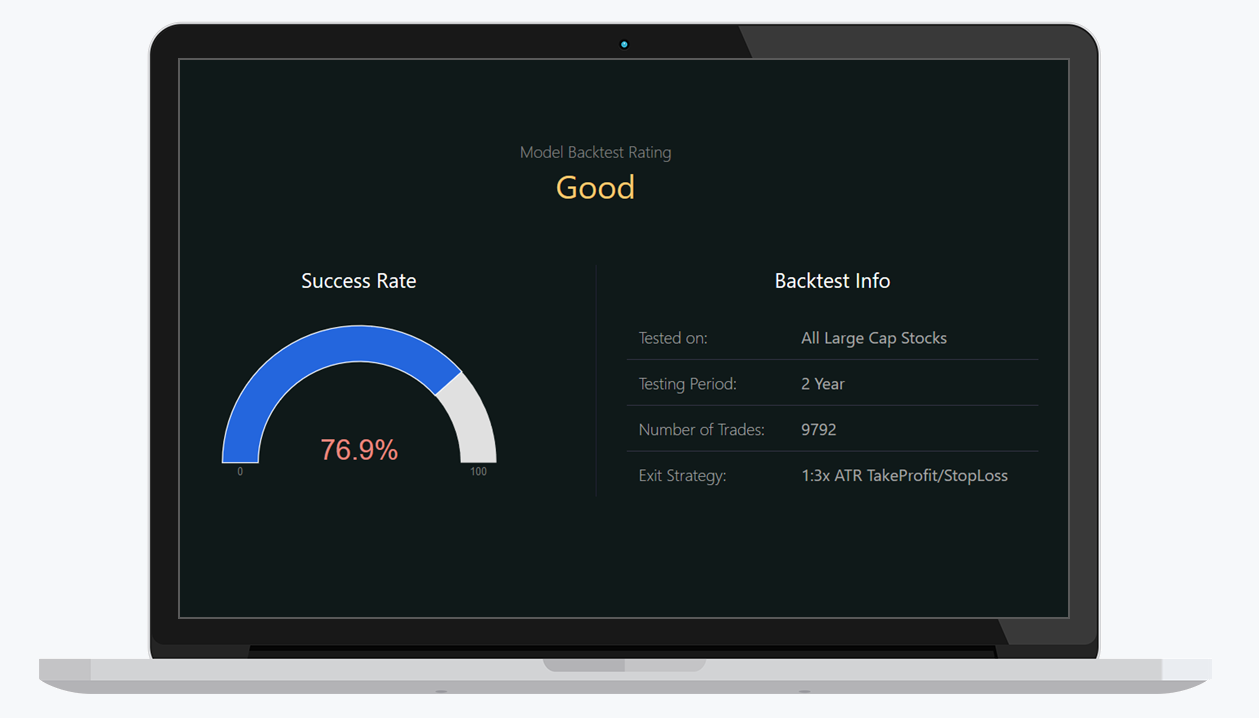
Quant Models are constantly tested and analyzed on each stock separately, as well as on sectors, market cap groups and the whole universe.

For each model, thousands of different exit strategies, testing periods and model parameters are tested simultaneously to identify best combinations that work and to filter out the ones that do not work.

Models then are rated based on their historical predictive power (Success Rate during back-test)

Backtest Details & Charting

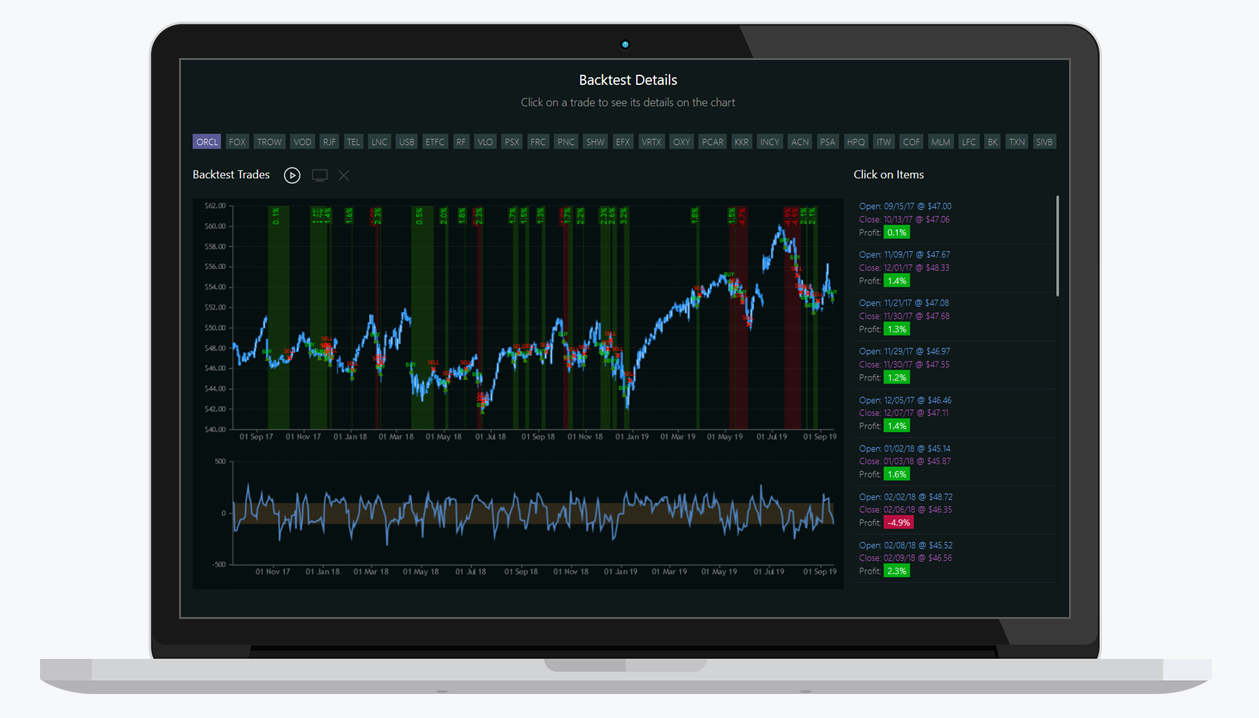
Arizet's A.I. is not a "black-box" strategy. It provides a comprehensive visual features to analyze Models past performance and assess their quality.

Backtest Details and Charting view shows stock price chart and historical trades made by the Model. You can zoom in/out, scroll and animate the chart, click on a specific trade and analyze it in every detail.

Backtest Statistics

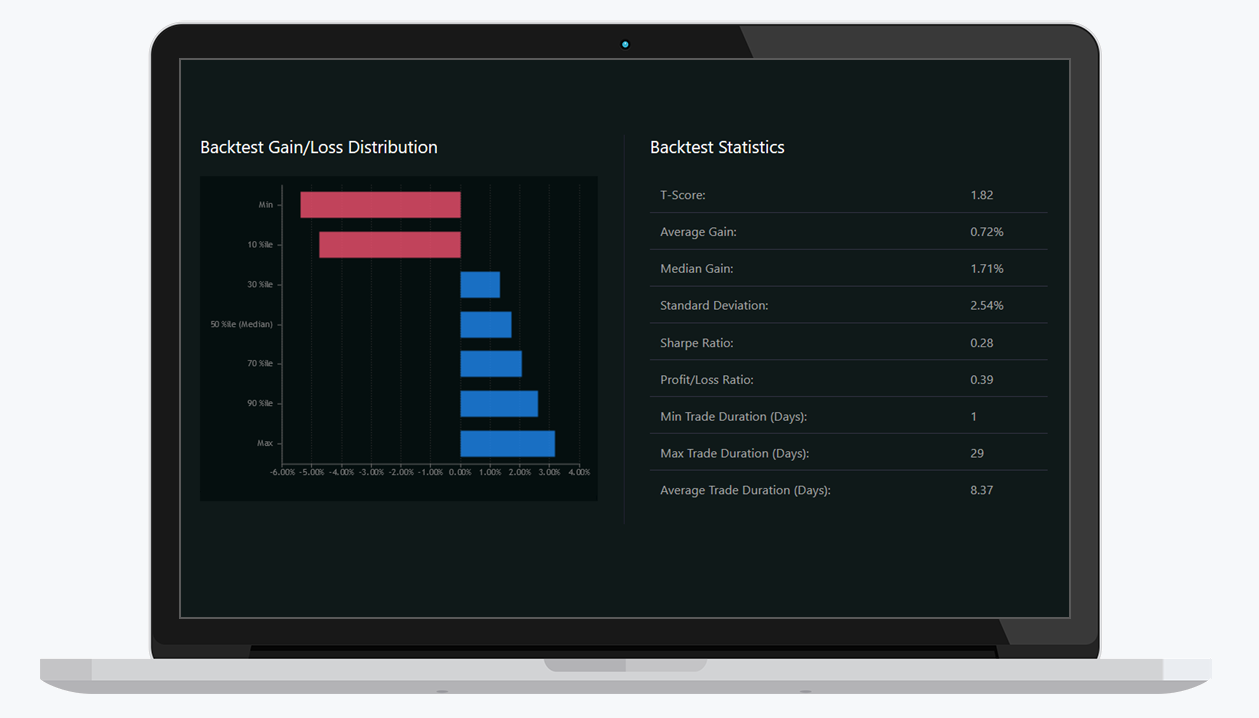
Statistics section shows gain/loss distribution over the testing period, as well as statistical outputs from the back-test to allow you better assess the effectiveness of the Model.

Some important data points you might want to analyze are:

  • T-Score: shows the confidence level for the Model performance.
  • Average/Median Gain: to estimate potential risk/reward based on historical performance.
  • Sharpe Ratio: for Risk-Adjusted returns.
  • Trade Durations: To understand how long the Model suggested trades will last on average.

What users say about QuantumStocks

Love it! The Heatpmap and Gain/Loss analytics are amazing. Takes seconds to figure out if the stock is a good candidate or not. Screens and Smart Search are also very helpful. Easy to find opportunities with almost every topic in mind. This will save me hours of research every week.


- Full-time Stock Trader
This is quite unique. Looks like I can find trading opportunities every day. With detailed back-testing, Take Profit and Stop Loss recommendations, I feel I can pick winning trades with much more confidence.


- Part-time trader, manages personal assets
Huge amount of data is analyzed and presented in a very easy-to-use manner. I will use this just for gain/loss predictions with each suggested trade. It's a fantastic feature.


- Part-time trader, manages personal assets

Choose the right plan for you

Starter
$19.95
/ user / month
Best suited for beginners and small casual traders. You will get daily stock recommendations with and Analytics.
What you get:
Daily Quant Scores for 3,500 U.S. stocks
Daily BUY/SELL signals on 3,500 U.S. stocks
Email alerts on the stocks in your Watchlist
Up to 15 stocks in the Watchlist
Stock & Model Detailed Analytics
Expected Gain/Loss Analytics with Signals
Advanced Screening by Fundamentals
Stock Smart Search
Company Basic Information
News headlines and topics
Similar Historical Pattern Discovery
Model Back-tests comparison
Business Analytics
Twitter Analytics
Company News Intelligence
Ability to follow individual Models
Option to buy Proprietary Arizet Models
Customized Stock Screeners
Customized Quant Score calculations
API access to scores and signals
Ability to integrate your Models to Arizet
BEST VALUE
Plus
$59.95
/ user / month
Best suited for experienced individual investors who manage personal assets. You will get full analytical capabilities.
What you get:
Daily Quant Scores for 3,500 U.S. stocks
Daily BUY/SELL signals on 3,500 U.S. stocks
Email alerts on the stocks in your Watchlist
Up to 50 stocks in the Watchlist
Stock & Model Detailed Analytics
Expected Gain/Loss Analytics with Signals
Advanced Screening by Fundamentals
Stock Smart Search
Company Basic Information
News headlines and topics
Similar Historical Pattern Discovery
Model Back-tests comparison
Business Analytics
Twitter Analytics
Company News Intelligence
Ability to follow individual Models
Option to buy Proprietary Arizet Models
Customized Stock Screeners
Customized Quant Score calculations
API access to scores and signals
Ability to integrate your Models to Arizet
Pro
$285.00
/ user / month
Best suited for professional traders and firms. Full analytical and API access to Arizet Data and Analytics.
What you get:
Daily Quant Scores for 3,500 U.S. stocks
Daily BUY/SELL signals on 3,500 U.S. stocks
Email alerts on the stocks in your Watchlist
Unlimited stocks in the Watchlist
Stock & Model Detailed Analytics
Expected Gain/Loss Analytics with Signals
Advanced Screening by Fundamentals
Stock Smart Search
Company Basic Information
News headlines and topics
Similar Historical Pattern Discovery
Model Back-tests comparison
Business Analytics
Twitter Analytics
Company News Intelligence
Ability to follow individual Models
Option to buy Proprietary Arizet Models
Customized Stock Screeners
Customized Quant Score calculations
API access to scores and signals
Ability to integrate your Models to Arizet

Who we are

David Davtyan

Execution

10 years in technology (US & Armenia)

4 years in US equity research - Research Analyst and Director of Systems Engineering

MS in Applied Math & CS from YSU, 1999

MBA from Wharton, 2011

Razmik Davtyan

Science

Background in theoretical physics (published in  Int. J. Phys. Rev. D.)

3 years in math modeling and statistical analysis for commodity, FX and equity trading

MS in Physics from YSU, 2005


Armen Nikoghosyan

Clients

9 years in corporate client engagement, including IBM, Toshiba and Mitsubishi

MS in Engineering, SEUA, 2001

PMP, Six Sigma, CMMI, ISO Quality Standards, Scrum Certified

Rick Van Nostrand, CFA

Strategy

Partner and Senior Portfolio Manager, Cornerstone Investment Partners, LLC. Strategy Advisor to Arizet Labs

19 years in Asset Management, 5 years in Management Consulting at McKinsey & Accenture

MBA from Wharton, 1998
DISCLAIMER:

Arizet QuantumStocks provides trading signals based on computerized systems and algorithms. All customers receive the same signals within any given algorithm package. All advice is impersonal and not tailored to any specific individual's unique situation. Arizet, and its principles, are not required to register with the NFA as a CTA and are publicly claiming this exemption. Information posted online or distributed through email has NOT been reviewed by any government agencies — this includes but is not limited to back-tested reports, statements and any other marketing materials. Carefully consider this prior to purchasing our algorithms. For more information on the exemption we are claiming, please visit the NFA website: http://www.nfa.futures.org/nfa-registration/cta/index.html. If you are in need of professional advice unique to your situation, please consult with a licensed broker/CTA.

Unless otherwise noted, all returns posted on this site and in our videos is considered Hypothetical Performance. HYPOTHETICAL PERFORMANCE RESULTS HAVE MANY INHERENT LIMITATIONS, SOME OF WHICH ARE DESCRIBED BELOW. NO REPRESENTATION IS BEING MADE THAT ANY ACCOUNT WILL OR IS LIKELY TO ACHIEVE PROFITS OR LOSSES SIMILAR TO THOSE SHOWN. IN FACT, THERE ARE FREQUENTLY SHARP DIFFERENCES BETWEEN HYPOTHETICAL PERFORMANCE RESULTS AND THE ACTUAL RESULTS SUBSEQUENTLY ACHIEVED BY ANY PARTICULAR TRADING PROGRAM. ONE OF THE LIMITATIONS OF HYPOTHETICAL PERFORMANCE RESULTS IS THAT THEY ARE GENERALLY PREPARED WITH THE BENEFIT OF HINDSIGHT. IN ADDITION, HYPOTHETICAL TRADING DOES NOT INVOLVE FINANCIAL RISK, AND NO HYPOTHETICAL TRADING RECORD CAN COMPLETELY ACCOUNT FOR THE IMPACT OF FINANCIAL RISK IN ACTUAL TRADING. FOR EXAMPLE, THE ABILITY TO WITHSTAND LOSSES OR ADHERE TO A PARTICULAR TRADING PROGRAM IN SPITE OF TRADING LOSSES ARE MATERIAL POINTS WHICH CAN ALSO ADVERSELY AFFECT ACTUAL TRADING RESULTS. THERE ARE NUMEROUS OTHER FACTORS RELATED TO THE MARKETS IN GENERAL OR TO THE IMPLEMENTATION OF ANY SPECIFIC TRADING PROGRAM WHICH CANNOT BE FULLY ACCOUNTED FOR IN THE PREPARATION OF HYPOTHETICAL PERFORMANCE RESULTS AND ALL OF WHICH CAN ADVERSELY AFFECT ACTUAL TRADING RESULTS.

© 2023 Arizet Labs, LLC
Privacy / Terms

Questions? Suggestions?

+1 267-949-6940
Atlanta, US

+1 718-607-1839
New York, US

+374 55 88-96-69
Yerevan, Armenia

Address:
1213 Barrington Oaks Pl.
Roswell, GA 30075

connect@arizet.com